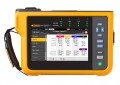
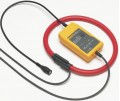
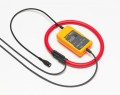
Model: 435-II | Order No: 435-II Series
The Power Quality analyzers that can monetize the cost of energy waste due to poor power quality. More powerful sampling options, greater accuracy and larger memory makes the Fluke 435-II better for longer term, higher resolution or more demanding power quality studies. The wide range of measurement functions and measurement methods make it the perfect tool for both power quality troubleshooting and discovering energy savings. Whether you’re checking the performance of motors and generators, trying to discover the source of an intermittent power problem or performing an energy study…this tool gives you the data you need to quickly get to the source of the problem.
Discontinued!
This product has been discontinued and is no longer available.
There is no direct replacement, however we recommend the:
Not what you're looking for? Let’s do a search and help you find what you need.
Think of the Fluke 435 II Power Quality and Energy Analyzer as your insurance policy. No matter what goes wrong in your facility, with the 435 II you will always be prepared. Equipped with advanced power quality functions and energy monetization capabilities, there is no electrical issue this model can't handle.
The new 430 Series II Power Quality and Energy
Analyzers offer the best in power quality analysis
and introduce, for the first time ever, the ability
to monetarily quantify energy losses.
The new Fluke 434, 435 and 437 Series II
models help locate, predict, prevent, and troubleshoot power quality problems in three-phase
and single-phase power distribution systems.
Additionally, the Fluke-patented energy loss
algorithm, Unified Power Measurement, measures
and quantifies energy losses due to harmonics
and unbalance issues, allowing the user to pinpoint
the origin of energy waste within a system.
Fluke's patented Unified Power Measurement system (UPM) provides the most comprehensive view of power available, measuring:
These UPM calculations are used to quantify the fiscal cost of energy loss caused by power quality issues. The calculations are computed, along with other facility-specific information, by an Energy Loss Calculator that ultimately determines how much money a facility loses due to wasted energy.
Traditionally energy savings are achieved by monitoring and targeting, or in other words, by finding the major loads in a facility and optimizing their operation. The cost of power quality could only be quantified in terms of downtime caused by lost production and damage to electrical equipment. The Unified Power Measurement (UPM) method now goes beyond this to achieve energy savings by discovering the energy waste caused by power quality issues. Using the Unified Power Measurement, Fluke's Energy Loss Calculator (see screen shot below) will determine how much money a facility is losing due to waste energy.
UPM gives a more comprehensive breakdown of the energy consumed in the plant. In addition to measuring reactive power (caused by poor power factor), UPM also measures the energy waste caused by unbalance; the effect of unevenly loading each phase in three-phase systems. Unbalance can often be corrected by reconnecting loads on different phases to ensure the current drawn on each phase is as equal as possible. Unbalance can also be corrected by installing an unbalance reactance device (or filter), that will minimize the effects. Correcting unbalance should be basic good housekeeping in the facility as unbalance problems can cause motor failure or shorten equipment life expectancy. Unbalance also wastes energy. Using UPM can minimize or eliminate that energy waste, thus saving money.
UPM also provides details of the energy wasted in your facility due to the presence of harmonics. Harmonics may be present in your facility due to the loads you operate or may be caused by loads in adjacent facilities. The presence of harmonics in your facility can lead to:
Quantifying the cost of wasted energy due to the presence of harmonics simplifies the return-on investment calculation needed to justify purchasing harmonic filters. By installing a harmonic filter the ill effects of harmonics can be reduced and energy waste eliminated, resulting in lower operational costs and more reliable operation.
For some users, loads switching is a cause of power quality problems. When loads switch on, the current draw sometimes causes the voltage to drop to a level that causes other equipment to malfunction. The PowerWave function available in the 435 and 437 Series II models enables users to capture voltage, current and frequency signals simultaneously at a high speed to see which interaction is potentially causing problems. PowerWave goes beyond standard power quality measurements; PowerWave's fast data capture mode enables system dynamics to be characterized. Waveforms for voltage and current are continuously captured for the specified time, and are displayed on screen in high detail; the power waveform is derived from the data. In addition, half-cycle RMS values for voltage, current, power and frequency can be stored and retrieved for analysis. This feature is particularly useful for testing of standby generation systems and UPS systems where reliable switch-on can be vital.
Power inverters take DC current and transform it into AC current, or vice versa. Solar generation systems usually include an inverter that takes the DC energy from the solar cells and converts it to useful AC power. Inverters can lose performance over time and need to be checked. By comparing the input power with the output power you can determine the system efficiency. The 435 and 437 II models can measure the efficiency of such inverters by simultaneously measuring the DC and AC power of a system to determine how much power is lost in the conversion process.
Measure true-rms, peak voltage and current, frequency, dips and swells, transients, interruptions, power and power consumption, peak demand, harmonics up to the 50th, inter-harmonics, flicker, mains signaling, inrush and unbalance.
User-configurable, long-term recording of MIN, MAX and AVG readings for up to 150 parameters on all 4 phases. Enough memory is available to record 600 parameters for over a year with 10 second resolution, or capture smaller variations with resolution down to 0.25 seconds. The logger function is quickly accessed by the LOGGER button, the simple step-by-step setup makes capturing your important measurements as easy as can be.
The Fluke 430 Series II analyzers provide three ways to analyze measurements. Cursors and zoom tools can be used "live" while taking measurements, or "off line" on stored measurement data. Additionally, the stored measurements can be transferred to a PC with the included software to perform custom analysis and create reports. Measurement data can also be exported to common spreadsheet programs. Store hundreds of measurement datasets and screen captures for use in reports (depending on memory capacity).
Pre-programmed setups and user-friendly screens make power quality testing as simple as you would expect from Fluke. The high-resolution color screen updates every 200 ms and displays waveforms and wiring diagrams color coded to industry standards. Handy on-screen wiring diagrams for all commonly used three-phase and single-phase configurations guide you through connections.
Designed to help protect you and your equipment, the Fluke 430 Series II analyzers and accessories are all certified to meet the stringent standards for use in CAT IV 600 V and CAT III 1000 V environments such as power connections and outlets throughout a low-voltage power distribution system.
Every time an event or voltage distortion is detected, the instrument triggers and automatically stores voltage and current waveforms on all three phases and neutral. The analyzer will also trigger when a certain current level is exceeded. Hundreds of dips, swells, interruptions and transients can be captured this way. You can see voltage transients as high as 6 kV and as fast as 5 microseconds.
The MONITOR mode delivers a dashboard display of
rms voltage, harmonics, flicker, interruptions, rapid
voltage changes, swells, unbalance, frequency and
mains signaling.
The dashboard is updated live, showing compliance of each parameter to EN50160 limits or your
own limits. Color-coded bars clearly show which
parameters are inside (pass) or outside (fail) limits.
During a monitor session, you can easily drill
down to more detail of any parameter to view and
capture its trend for a report.
437-II | 435-II | 434-II | |
---|---|---|---|
Measurement algorithms | |||
Voltage accuracy | 0.1 % of Vnom | 0.1 % of Vnom | 0.5 % of Vnom |
Class compliance | A | A | S |
Time synchronization | Optional with GPS430 accessory |
Power quality measurement is a relatively new, and quickly evolving field. There are hundreds of manufacturers around the world with unique measurement methodologies. Whereas basic single- and three-phase electrical measurements like rms voltage and current were defined long ago, many power quality parameters were not previously defined, forcing manufacturers to develop their own algorithms. With so much variation between instruments, electricians tend to waste too much time trying to understand an instrument's capabilities and measurement algorithms instead of understanding the quality of the power itself! The new IEC 61000-4-30 Edition 2 Class-A standard takes the guesswork out of selecting a power quality instrument. The standard IEC 61000-4-30 Edition 2 defines the measurement methods for each parameter to obtain reliable, repeatable and comparable results. In addition, the accuracy, bandwidth and minimum set of parameters are all clearly defined. The 435 and 437 Series II models include flagging and available internal clock time-synching to fully comply with the rigorous requirements of Class A compliance. The Edition 2 standard includes a new class of instrument, Class S. While not as accurate as Class A instruments, Class S instruments such as the 434 Series II Energy Analyzer produce results that are consistent with Class A instruments.
Model | Measurement range | Resolution | Accuracy | |
---|---|---|---|---|
Volt | ||||
Vrms (ac+dc) | 435-II | 1 V to 1000 V phase to neutral | 0.01 V | ± 0.1% of nominal voltage**** |
Vpk | 1 Vpk to 1400 Vpk | 1 V | 5% of nominal voltage | |
Voltage Crest Factor (CF) | 1.0 > 2.8 | 0.01 | ± 5 % | |
Vrms½ | 435-II | 0.1 V | ± 0.2% of nominal voltage | |
Vfund | 435-II | 0.1 V | ± 0.1% of nominal voltage | |
Amps (accuracy excluding clamp accuracy) | ||||
Amps (ac +dc) | i430-Flex 1x | 5 A to 6000 A | 1 A | ± 0.5% ± 5 counts |
i430-Flex 10x | 0.5 A to 600 A | 0.1 A | ± 0.5% ± 5 counts | |
1mV/A 1x | 5 A to 2000 A | 1A | ± 0.5% ± 5 counts | |
1mV/A 10x | 0.5 A A to 200 A (ac only) | 0.1 A | ± 0.5% ± 5 counts | |
Apk | i430-Flex | 8400 Apk | 1 Arms | ± 5 % |
1mV/A | 5500 Apk | 1 Arms | ± 5 % | |
A Crest Factor (CF) | 1 to 10 | 0.01 | ± 5 % | |
Amps½ | i430-Flex 1x | 5 A to 6000 A | 1 A | ± 1% ± 10 counts |
i430-Flex 10x | 0.5 A to 600 A | 0.1 A | ± 1% ± 10 counts | |
1mV/A 1x | 5 A to 2000 A | 1A | ± 1% ± 10 counts | |
1mV/A 10x | 0.5 A A to 200 A (ac only) | 0.1 A | ± 1% ± 10 counts | |
Afund | i430-Flex 1x | 5 A to 6000 A | 1 A | ± 0.5% ± 5 counts |
i430-Flex 10x | 0.5 A to 600 A | 0.1 A | ± 0.5% ± 5 counts | |
1mV/A 1x | 5 A to 2000 A | 1A | ± 0.5% ± 5 counts | |
1mV/A 10x | 0.5 A A to 200 A (ac only) | 0.1 A | ± 0.5% ± 5 counts | |
Hz | ||||
Hz | Fluke 435 @ 50 Hz nominal |
42.500 Hz to 57.500 Hz | 0.001 Hz |
± 0.01 Hz |
Fluke 435 @ 60 Hz nominal | 51.000 Hz to 69.000 Hz | 0.001 Hz |
± 0.01 Hz |
|
Power | ||||
Watts (VA, var) | i430-Flex |
max 6000 MW | 0.1 W to 1 MW | ± 1% ± 10 counts |
1 mV/A | max 2000 MW | 0.1 W to 1 MW | ± 1% ± 10 counts | |
Power factor (Cos j/DPF) | 0 to 1 | 0.001 | ± 0.1% @ nominal load conditions | |
Energy | ||||
kWh (kVAh, kvarh) | i430-Flex 10x | Depends on clamp scaling and V nominal | ± 1% ± 10 counts | |
Energy loss | i430-Flex 10x | Depends on clamp scaling and V nominal | ± 1% ± 10 counts Excluding line resistance accuracy | |
Harmonics | ||||
Harmonic order (n) | DC, 1 to 50 Grouping: Harmonic groups according to IEC 61000-4-7 | |||
Inter-harmonic order (n) | OFF, 1 to 50 Grouping: Harmonic and Interharmonic subgroups according to IEC 61000-4-7 | |||
Volts | %f | 0.0 % to 100 % | 0.1 % | ± 0.1% ± n x 0.1 % |
%r | 0.0 % to 100 % | 0.1 % | ± 0.1% ± n x 0.4 % | |
Absolute | 0.0 to 1000 V | 0.1 V | ± 5% * | |
THD | 0.0 % to 100 % | 0.1 % | ± 2.5 % | |
Amps | %f | 0.0 % to 100 % | 0.1 % | ± 0.1% ± n x 0.1% |
%r | 0.0 % to 100 % | 0.1 % | ± 0.1% ± n x 0.4 % | |
Absolute | 0.0 to 600 A | 0.1 A | ± 5% ± 5 counts | |
THD | 0.0 % to 100 % | 0.1 % | ± 2.5 % | |
Watts | %f or %r | 0.0 % to 100 % | 0.1 % | ± n x 2% |
Absolute | Depends on clamp scaling and V nominal | - | ± 5% ± n x 2 % ± 10 counts | |
THD | 0.0 % to 100 % | 0.1 % | ± 5 % | |
Phase Angle | -360° to +0° | 1° | ± n x 1° | |
Flicker | ||||
Plt, Pst, Pst(1min) Pinst | 0.00 to 20.00 | 0.01 | ± 5 % | |
Unbalance | ||||
Volts | % | 0.0 % to 20.0 % | 0.1 % | ± 0.1 % |
Amps | % | 0.0 % to 20.0 % | 0.1% | ± 1 % |
Mains signaling | ||||
Threshold levels | Threshold, limits and signaling duration is programable for two signaling frequencies | - | - | |
Signaling frequency | 60 Hz to 3000 Hz | 0.1 Hz | ||
Relative V% | 0 % to 100 % | 0.10 % | ± 0.4 % | |
Absolute V3s (3 second avg.) | 0.0 V to 1000 V | 0.1 V | ± 5 % of nominal voltage |
General specifications | ||||
---|---|---|---|---|
Case | Design Rugged, shock proof with integrated protective holster Drip and dust proof IP51 according to IEC60529 when used in tilt stand position Shock and vibration Shock 30 g, vibration: 3 g sinusoid, random 0.03 g 2 /Hz according to MIL-PRF-28800F Class 2 | |||
Display | Brightness: 200 cd/m 2 typ. using power adapter, 90 cd/m 2 typical using battery power Size: 127 mm x 88 mm (153 mm/6.0 in diagonal) LCD Resolution: 320 x 240 pixels Contrast and brightness: user-adjustable, temperature compensated | |||
Memory | 8GB SD card (SDHC compliant, FAT32 formatted) standard, upto 32GB optionally Screen save and multiple data memories for storing data including recordings (dependent on memory size) | |||
Real-time clock | Time and date stamp for Trend mode, Transient display, System Monitor and event capture |
Environmental | ||||
---|---|---|---|---|
Operating temperature | 0 °C ~ +40 °C; +40 °C ~ +50 °C excl. battery | |||
Storage temperature | -20 °C ~ +60 °C | |||
Humidity | +10 °C ~ +30 °C: 95% RH non-condensing +30 °C ~ +40 °C: 75% RH non-condensing +40 °C ~ +50 °C: 45% RH non-condensing |
|||
Maximum operating altitude | Up to 2,000 m (6666 ft) for CAT IV 600 V, CAT III 1000 V Up to 3,000 m (10,000 ft) for CAT III 600 V, CAT II 1000 V Maximum storage altitude 12 km (40,000 ft) |
|||
Electro-Magnetic-Compatibility (EMC) | EN 61326 (2005-12) for emission and immunity | |||
Interfaces | mini-USB-B, Isolated USB port for PC connectivity SD card slot accessible behind instrument battery | |||
Warranty | Three years (parts and labor) on main instrument, one year on accessories |
*± 5 % if ? 1 % of nominal voltage ± 0.05 % of nominal voltage if < 1% of nominal voltage
** 50Hz/60Hz nominal frequency according to IEC 61000-4-30
*** 400Hz measurements are not supported for Flicker, Mains Signaling and Monitor Mode.
****for nominal voltage 50 V to 500 V
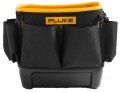
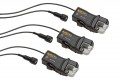
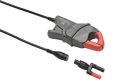
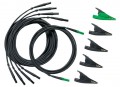
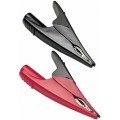
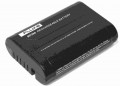
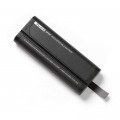
Click on a category to view a selection of compatible accessories with the Fluke 435-II Series of Power Quality Analyzers.